
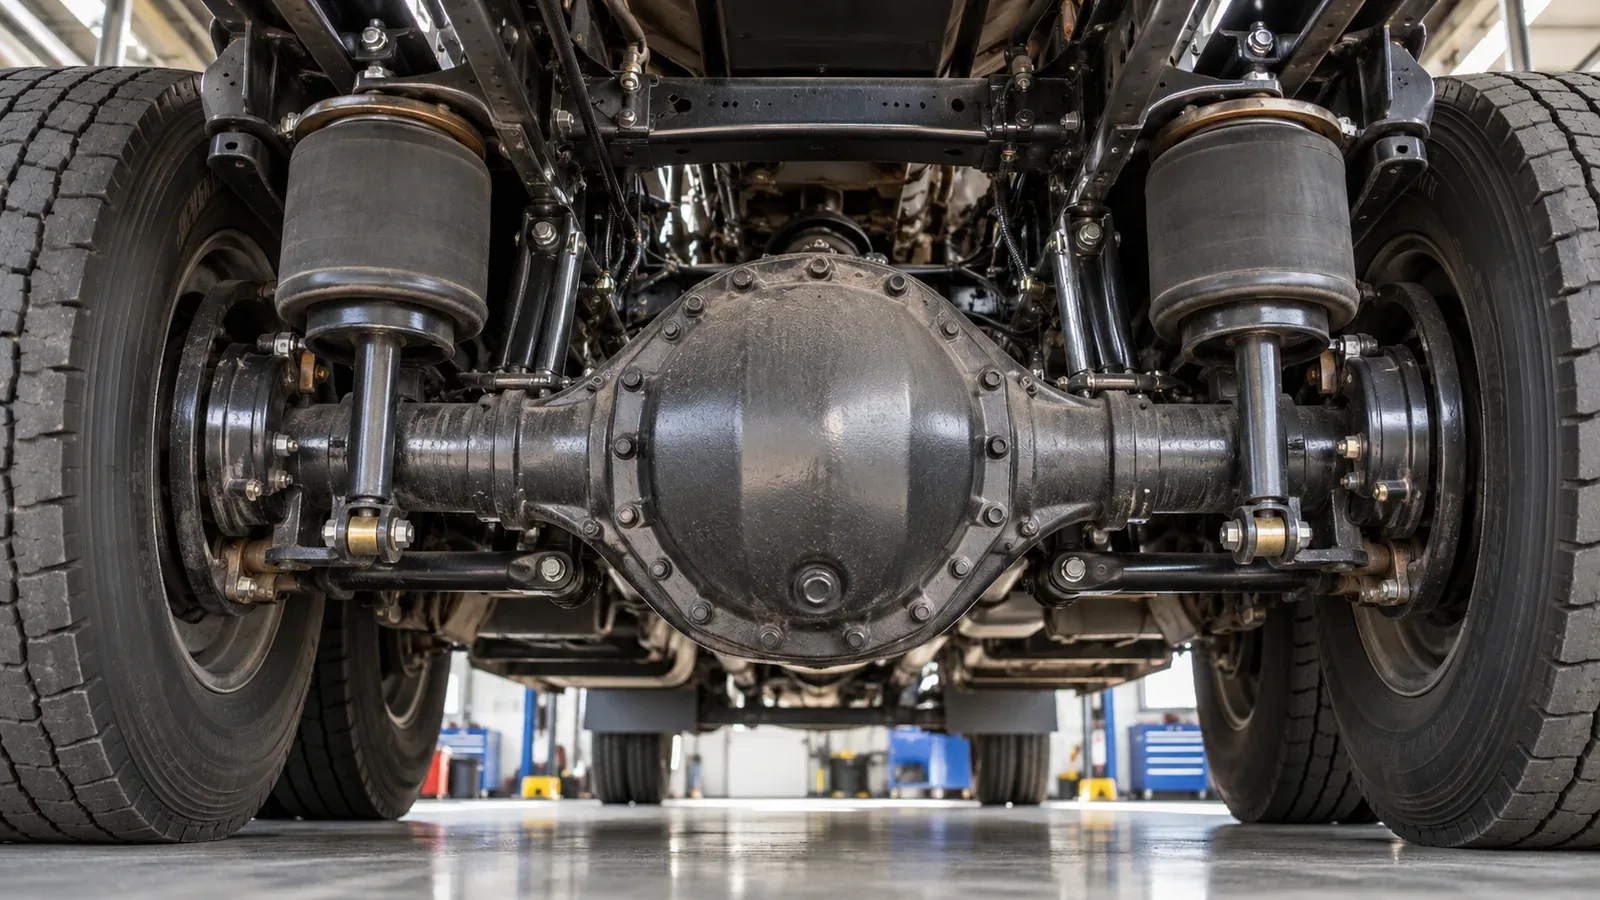
Semi-Truck Axle Ratios Explained: RPM, MPG and Hill Climbing
Two used tractors can look nearly identical, share an engine family and still feel very different on the same freight lane. One cruises quietly at modest RPM on level Interstate miles; the other pulls away more eagerly but runs faster through the engine’s rev range at the same road speed. The rear axle ratio is one possible reason—but only when you understand the rest of the powertrain.
A buyer may see 2.64, 2.79, 3.08 or 3.36 in a specification sheet and assume that the smaller number is always an economy upgrade. Another may hear that a higher ratio is “better for hills” and conclude that an axle swap will solve weak grade performance. Both shortcuts ignore transmission gearing, tire rolling circumference, engine torque characteristics, approved ratings and the truck’s actual work.
This guide shows how to read the numbers, calculate a realistic cruise RPM, separate a simple math example from an OEM-approved configuration and ask better questions when buying or spec’ing a tractor. It is an explanation and decision worksheet—not a substitute for an engineered powertrain specification.
What a semi-truck axle ratio actually measures
Inside a drive axle, a small pinion gear meshes with a larger ring gear. The ratio describes how many input/driveshaft revolutions correspond to one axle/wheel revolution, ignoring differential action during turning. For a conventional single-reduction final drive, divide the number of ring gear teeth by the number of pinion teeth.
For example, 41 ring-gear teeth ÷ 11 pinion teeth = 3.727…, conventionally written as about 3.73:1. Dana Spicer’s gear-ratio calculator explains the ring-and-pinion calculation directly. Actual commercial drivetrain arrangements can include multiple axles, inter-axle equipment or more complex reductions; read the OEM component description rather than assuming every tag means the same hardware.
- 2.64:1: roughly 2.64 driveshaft turns per axle revolution. It is called a numerically lower or “faster” ratio in a simple comparison.
- 3.36:1: roughly 3.36 driveshaft turns per axle revolution. It is numerically higher or “slower” gearing in the same comparison.
- More torque multiplication: for the same torque entering the differential, a numerically higher ratio produces more theoretical torque at the axle output, before losses. That does not say the entire truck can pull a given grade at highway speed.
The same manufacturer may offer several ratios for different load ratings and duty cycles. Mack’s axle specification table lists multiple combinations, while Cummins’ 17X HE drive axle shows ratios such as 2.06, 2.17, 2.31, 2.47, 2.64, 2.85, 3.08 and 3.36 for a specific approved product family. Those are available component options, not a universal recommendation for your tractor.
How the transmission and tires change the answer
A ratio listing by itself cannot predict the tachometer. Engine speed at a given road speed is controlled by three separate conversion steps: tire revolutions per mile, selected transmission gear and axle reduction.
The basic formula for a mechanically coupled driveline:
Engine RPM = (road speed in mph × tire revolutions per mile × selected transmission gear ratio × axle ratio) ÷ 60.
This matches the relationships used by Dana’s transmission/RPM calculator. It assumes the drivetrain is fully engaged without significant slip; it is not appropriate for every operating state of a torque-converter automatic.
The tire input should be loaded rolling revolutions per mile from the actual tire specification, not a guessed outside diameter. Two tires with the same nominal size can have different published rolling values, and replacements and wear can change the result. The selected top gear may be 1.00:1 direct drive or a sub-1.00:1 overdrive, among other possibilities.
Worked example: 65 mph, 500 tire revolutions per mile
To make the differences easy to inspect, hold road speed at 65 mph, tire rolling frequency at 500 revolutions per mile and transmission top gear at 1.00:1 direct drive. These are explicitly illustrative inputs, not the tire or gearbox specification of a particular truck.
| Rear axle ratio | Transmission ratio | Calculated engine RPM at 65 mph |
|---|---|---|
| 2.64:1 | 1.00:1 | 1,430 RPM |
| 2.79:1 | 1.00:1 | about 1,511 RPM |
| 3.08:1 | 1.00:1 | about 1,668 RPM |
| 3.36:1 | 1.00:1 | 1,820 RPM |
The first row is 65 × 500 × 1.00 × 2.64 ÷ 60 = 1,430 RPM. The last row is 65 × 500 × 1.00 × 3.36 ÷ 60 = 1,820 RPM. With everything else held constant, the numerically higher ratio raises RPM by 390 in this example—a mechanical calculation, not an observed efficiency result.
Now consider the trap: a different tractor has a 3.55 rear axle but uses 0.78:1 overdrive in its cruising gear. Its calculation is 65 × 500 × 0.78 × 3.55 ÷ 60 ≈ 1,500 RPM. Despite its higher axle number, this truck sits much closer to the 2.79/direct-drive example than the 3.36/direct-drive example.
Comparison rule: do not rank used trucks on the rear axle ratio without also writing down the tire model’s revolutions per mile and the transmission’s actual cruising gear ratio. Even then, predicted RPM is only one of the inputs to a complete performance assessment.
What the ratio means for acceleration and hill starts
Suppose a transmission delivers an illustrative 1,500 lb-ft to a final drive. A 2.64 differential would multiply that to roughly 3,960 lb-ft at the axle output, while a 3.36 would produce 5,040 lb-ft, before mechanical losses. This isolates one part of the driveline; it does not calculate force at the tire contact patch, gradeability or legal towing capacity.
Real launch performance also depends on the transmission’s lowest gear, engine torque over its operating range, clutch strategy, gross combination weight, tire radius, traction and the slope. For example, an AMT with an especially deep starting gear can substantially change launch torque while retaining an axle chosen for economical highway travel.
Likewise, hill climbing at speed is fundamentally a power and gearing problem. More multiplication cannot create additional engine horsepower. A truck may downshift to place the engine in a useful power band, and the result depends on its cooling system, temperature, payload, grade and road conditions. A driveline should never be operated beyond its stated manufacturer limits simply because the axle has a numerically higher ratio.
Before specifying a truck for steep routes, ask the dealer or OEM to verify at least three separate conditions:
- Startability: can the approved powertrain start safely at the intended weight on the required incline?
- Gradeability: can the combined vehicle climb the planned grades at a useful, safe speed, with the available gear steps?
- Driveline ratings: are the axle input torque, transmission, driveshafts, cooling and other components approved for the specific configuration?
For a vehicle already in your fleet, a qualified technician should evaluate unexplained loss of hill performance instead of prescribing a gearing change based on a single symptom. Engine faults, wrong shift behavior, brakes, excess weight and tire problems can produce similar complaints.
Will a numerically lower axle ratio improve fuel economy?
Not automatically. It is reasonable to expect lower RPM at fixed mph when the only change is the final drive ratio. But engine efficiency is not a straight line where fewer revolutions always consume fewer gallons. The engine must still produce the power demanded by drag, rolling resistance, grades and payload, and it needs to do so in an efficient operating region.
Cummins describes lower numerical ratios as helpful for certain steady highway applications and higher ratios as potentially useful where starting and grades matter. The North American Council for Freight Efficiency similarly discusses engine downspeeding: integrating the axle, transmission and torque characteristics so an engine can cruise at lower RPM without unacceptable drivability or durability trade-offs.
Possible reasons a lower-RPM configuration fails to deliver the expected fuel result include:
- The engine operates below a suitable efficient-load band and needs frequent downshifts.
- The truck repeatedly transitions between flat highway and demanding hills.
- Tire rolling resistance, aerodynamics, trailer choice and speed overwhelm the gearing change.
- The transmission spends less time in the assumed top gear than a spreadsheet predicts.
- Increased driveline torque or unsuitable application settings create a cost not reflected in a fuel-only estimate.
This is why a reduction in tachometer RPM is not an MPG measurement. To understand actual consumption, use the measurement method in our semi-truck MPG guide, which focuses on gallons, miles, route normalization and operating conditions rather than axle theory.
A fuel-cost sensitivity example, not a fuel-saving claim
Imagine an owner-operator travels 110,000 miles per year and pays an illustrative average $4.00 per gallon. If controlled records eventually show 6.4 MPG for one configuration and 6.6 MPG for another under otherwise comparable conditions, annual fuel costs would be approximately:
| Measured scenario, if achieved | Gallons per year | Fuel at $4.00/gal |
|---|---|---|
| 6.4 MPG | 17,187.5 | $68,750 |
| 6.6 MPG | about 16,666.7 | about $66,667 |
| Illustrative difference | about 520.8 fewer gallons | about $2,083/year |
Nothing in that calculation says an axle change will improve a truck from 6.4 to 6.6 MPG. Those MPG figures are intentionally assumed to show the financial sensitivity if a genuine, repeatable difference is independently established. A ratio alteration might produce no benefit—or a disadvantage—on a different route.
For a complete decision, include the equipment cost, financing, downtime, resale risk and repair exposure. Our cost-per-mile calculator can help place a verified fuel change among other expenses, and the truck replacement calculator helps compare replacing a complete unit rather than focusing on one component.
Direct drive versus overdrive: why ‘2.64’ cannot tell the whole story
In direct drive, the selected transmission gear is typically 1.00:1. In overdrive, that gear ratio is numerically below one. For the same axle and tires, overdrive further reduces engine speed at a fixed road speed—provided the truck actually remains in that gear.
The Eaton Cummins Endurant HD specifications illustrate why an exact product variant matters: gear schedules and available configurations are technical specifications, not interchangeable labels. The words “12-speed automated” or “highway gearing” on a listing cannot replace the transmission model and its ratio table.
Consider two otherwise comparable trucks in a seller’s lot:
| Configuration | Illustrative top gear | Axle | Effective top-gear × axle ratio |
|---|---|---|---|
| Truck A | 1.00 direct | 2.64 | 2.64 |
| Truck B | 0.78 overdrive | 3.36 | about 2.62 |
The two effective cruise ratios are extremely close, so their predicted RPM at the same true road speed and on identical rolling tires is also close. That does not mean they are mechanically equivalent in lower gears, use the same power, weigh the same, have equal losses or meet the same duty-cycle approvals.
When comparing manuals and automated manuals, our transmission guide explains the practical differences in shifting, clutches, fault history and service needs. This axle guide addresses a different question: the overall ratio between engine speed and wheel speed.
Choosing ratios for actual duty cycles
There is no single universal best axle ratio for an American Class 8 tractor. Start by recording how the truck will spend its paid and unpaid miles, not by searching for an isolated number.
Long-haul Interstate work
A linehaul truck may spend a high proportion of its time at steady legal cruise speeds. The specification process should identify the engine’s approved efficient operating band, top gear, tire revolutions per mile, real grades, typical weights and allowable drivetrain torque. Numerically lower gearing can be attractive, but only where the complete approved system supports it.
A buyer using mostly level Interstate routes still needs to account for ramps, grades, occasional stops and loaded starts. A perfect theoretical cruise RPM does little good if the truck is continually hunting gears in normal service.
Regional distribution with frequent stops
Regional work can introduce more launches, traffic variation, docks, mixed grades and significant off-highway time. Different gearing may produce better responsiveness, yet the transmission’s starting ratio and controls often matter more than the final-drive number alone. Do not ignore maneuvering and reverse behavior during the test drive.
Heavy-haul and mountainous work
Heavier combinations and steeper grades demand an application-specific review of startability, gradeability, torque ratings and transmission steps. Higher numerical axle ratios may be part of a suitable package, but they cannot substitute for sufficient engine power, cooling or safe operating limits. A configuration approved for linehaul service should not be assumed suitable for a special heavy-haul job.
Mixed-use owner-operators
A contractor who alternates between flat linehaul and hilly short-haul loads faces a trade-off. The sensible configuration may be a compromise selected around the most demanding repeatable job, not the most flattering MPG shown on one easy leg. Ask for the OEM’s complete powertrain application review before buying.
How to identify the axle ratio on a used semi-truck
A classified ad is only a starting point. Axles may have been repaired, regeared or replaced; wheels and tires may also differ from the original build. The goal is to confirm the installed components and their service condition.
- Request the VIN-based OEM build sheet: record the factory axle, transmission and tire specifications.
- Inspect the axle identification tags: a qualified technician can verify model, ratio and serial information where tags are readable and original.
- Match the parts and repair history: look for invoices showing replacement differentials, carriers, axle assemblies or changes to tire specification.
- Read the transmission identification: confirm the actual top-gear and starting ratios, not a sales description such as “automated 12-speed.”
- Verify tire revolutions per mile: identify the installed tire model and use its manufacturer’s published rolling specification when available.
- Compare to observed RPM carefully: check actual road speed and engaged gear under stable conditions; a mismatched tachometer reading is a diagnostic clue, not definitive proof of a wrong axle.
- Ask about electronic calibrations: depending on the truck, gearing and tire changes may require control-module or speed-calibration work.
- Have a commercial-truck shop evaluate condition: gear noise, leaks, lubricant contamination, vibrations or mismatched tandem components should not be waved away as a simple ratio preference.
Never crawl beneath a truck supported only by a jack or attempt to access rotating drivetrain components during a casual purchase inspection. Use a qualified facility with proper lifting and securing procedures.
For a vehicle-wide buying process, use the used semi-truck inspection checklist. It complements this gearing worksheet by covering engine, brakes, tires, emissions, records and the broader purchase decision.
Should you regear an existing tractor?
A ring-and-pinion or carrier change is not a reversible software setting. Depending on the axle, it may require compatible gears or a different carrier, precise mechanical setup, seals and bearings, lubricant work and electronic calibration. On tandem drives, component matching and manufacturer requirements are especially important. Warranty, resale, service support and drivetrain torque ratings should be documented in writing.
Before requesting a quotation, calculate a realistic total modification exposure:
| Cost category | What to ask the workshop |
|---|---|
| Parts and fitment | Gearset/carrier compatibility, required bearings and seals, matching tandem components |
| Labor and validation | Setup, wear-pattern verification, road test, control-module configuration |
| Downtime | Days genuinely unavailable for loads and the contribution margin at risk |
| Warranty and support | Labor/parts guarantee and OEM approval or restrictions |
| Long-term result | Independent fuel logs or powertrain engineering evidence, not an assumed MPG gain |
A shop quote may be reasonable and the project still economically unjustified. For example, if a hypothetical change cost $6,000 all-in and a properly controlled future trial showed $1,500 annual net benefit, the simple arithmetic payback would be four years before financing, tax effects, resale and maintenance risks. If the measured benefit is $0, no finite payback exists. Neither scenario predicts what a specific axle swap would achieve.
The right first question is usually: can an appropriately configured vehicle be purchased or selected instead of modifying one? Compare both paths using consistent cash-flow assumptions rather than automatically ordering parts.
A five-stage comparison worksheet for prospective buyers
Use this process when two trucks have different gearing numbers:
| Stage | Evidence to collect | Why it matters |
|---|---|---|
| 1. Define the work | Payload and gross combination weights, terrain, cruise-speed profile, dock starts | The duty cycle establishes required performance |
| 2. Identify hardware | VIN build, engine rating, transmission model, final-drive ratio and installed tires | Listings may omit crucial components |
| 3. Calculate cruising RPM | MPH, actual tire rev/mile, engaged top gear and axle ratio | Creates a consistent mechanical comparison |
| 4. Check OEM approval | Startability, gradeability, torque limits, engine operating band, cooling | A plausible RPM is not an approved configuration |
| 5. Compare lifecycle costs | Verified MPG, maintenance, purchase difference, potential downtime and resale | The cheapest fuel estimate may not give the cheapest truck |
Write down the evidence source for every input. Label missing information unknown, not zero, and ask the seller for records rather than fabricating a favorable number.
Three representative owner-operator situations
The situations below are constructed examples, not firsthand interviews or reported experiences from TheCarrierStandard readers.
Situation 1: a highway buyer attracted by a ‘fast’ axle
Problem: A seller advertises a 2.64 rear axle as a guaranteed fuel saver. Complication: The buyer’s current tractor uses overdrive while the advertised one uses direct drive, so the ratios are not directly comparable. Response: Compare transmission top-gear ratios, actual rolling tires and operating weights, then test MPG claims with comparable records. Lesson: A smaller axle number is not a measured operating-cost advantage.
Situation 2: an owner-operator who climbs grades every day
Problem: A truck struggles to hold speed with a loaded trailer on repeated hills. Complication: The owner assumes a higher rear axle ratio must solve the issue. Response: Have a qualified shop check engine output, fault history, allowed gears, cooling, weights and the OEM’s gradeability specification before pricing a change. Lesson: A drivetrain performance problem should be diagnosed as a system, not reduced to a differential number.
Situation 3: a low-mileage tractor with uncertain documentation
Problem: A used truck’s build sheet says 3.36 but a recent repair invoice mentions a different differential carrier. Complication: The seller cannot confirm what is currently installed. Response: Verify axle tags, repair parts and transmission data with a capable commercial-truck technician; resolve discrepancies before purchase. Lesson: An accurate equipment list matters more than the online listing’s confident wording.
Final decision: match the whole powertrain, not one number
A semi-truck axle ratio is a useful engineering input, not a standalone MPG rating, tow rating or hill-climbing guarantee. Lower numerical gearing often reduces engine RPM at a given speed when every other ratio remains fixed; higher numerical gearing increases theoretical final-drive torque multiplication at the same input torque. Those truths are mechanical starting points.
The buyer’s decision requires more: actual tire revs per mile, transmission gears, engine torque and efficiency, typical loads, hills, electronic controls, OEM approvals, condition and repeatable cost records. Start with the calculation; finish with an approved configuration and evidence that it fits the real job.
If you are comparing a powertrain rather than a differential in isolation, continue with our Cummins X15 vs. Detroit DD15 guide or the Freightliner Cascadia vs. Volvo VNL comparison. Those articles ask different questions about engine choices and complete tractors, while this one concentrates on gear multiplication and cruise RPM.